Below you will find pages that utilize the taxonomy term “Visualization”
I had always wanted to play with Processing (after leafing through The
Processing
Handbook and
Visualizing
Data
some years ago). My general dislike for Java or the JVM made me just play a
short amount of time with processing.js something around 2011 (there was a
native processing.js application for iOS, I used it for a while on my iPad and
iPod Touch).
Taken from Flickr
In case you have not realised it yet, I’m a pretty prolific reader. Online reading (and having an iPad) have slowed down the number of books I read in a given year, and I don’t go to the lengths of my girlfriend (who is about to reach her goal of reading 102 books in this year,) I’m nevertheless a frequent reader.
This year I’ve read several good books that I’d like to share with you, after all, if you are reading this probably our tastes overlap.
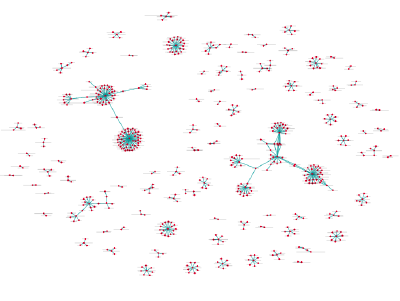
Using Gephi with Google Analytics to visualize keywords and landing pages
6 minutes read | 1087 words
As of late, I’ve been playing a lot with data analysis and visualization tools. Recently I’ve read two interesting books (Statistical Analysis with R and Visualize This: The FlowingData Guide to Design, Visualization, and Statistics and I’m on my way to another two to refresh my statistics knowledge.
But this post is only mildly related to these books, since it started way before: the day I read about Gephi. Gephi is an open source graph visualization tool, to work with huge (or at least big) datasets and graphs.

